Jupiter is the largest planet in the Solar System and contains nearly 3/4 of all planetary matter.
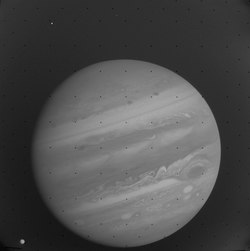
With no solid surface, Jupiter is a gas and liquid filled giant. Its turbulent belts of clouds circulate parallel to the equator and often contain oval spots which are storm systems with the largest being easily twice the diameter of Earth. The great red spot has been observed for at least 300 years and rotates counter-clockwise with wind speeds of 270 miles per hour [430 km/hr].
Although observed and studied from Earth for centuries it wasn’t until the mid 1970’s that humans were able to get a closer look with the spacecraft Pioneer 10 and 11. The Voyager 1 and 2 spacecraft were launched with the specific purpose of collecting information and data on the Jovian worlds. In December 1995 the Galileo spacecraft entered into orbit and began it’s long-term study of Jupiter and it’s moons, a probe was also sent deep into the atmosphere of the gas giant.
Astronomical units
[edit | edit source]
Main resource: Units/Astronomy
Notation: let the symbol RJ
Astrophysics
[edit | edit source]
Main resource: Astrophysics
- Diameter: 142,900 km (11.2 x Earth’s diameter)
- Length of Day: 9h 55m 30s
- Length of year: 11.867 years (4334.3 days)
- Average distance from the Sun: 5.2028 AU (7.783 x 10⁸ km)
- Average orbital velocity: 13.06 km/s.
- Average Density: 1.34g/cm3
- Mass: 1.899 x 1027 kg (317.83 x Earth’s Mass).
Jupiter has an equatorial radius of 71,492 ±4 km, a polar radius of 66,854 ±10 km, and a mean radius of 69,911 ± 6 km.[1]
Orbital characteristics (2002)
[edit | edit source]
(Epoch J2000, 17 May 2002):
- orbital radius: 778,330,000 km (5.20 AU) from Sun.
- aphelion: 815,700,000 km.
- perihelion: 740,900,000 km.
- orbital period: 4333 days.
Orbital characteristics (2004)
[edit | edit source]
(Epoch J2000, 20 September 2004 & 16 November 2004):
- aphelion: 816,620,000 km[2][3], 5.46 AU, 507,000,000 miles.
- perihelion: 740,520,000 km, 4.95 AU, 460,280,000 miles.
- semimajor: 778,300,000 km, 5.20336301 AU, 483,680,000 miles.
- eccentricity: 0.04839266.
- inclination: 1.30530°, (6.09° to Sun’s equator).
- longitude of ascending node: 100.55615°.
- argument of perihelion: 14.75385°.
- orbital circ: 4.888 Tm, 32.675 AU.
- sidereal period: 4,332.589 day, 11.862 julian year (yr).
- synodic period: 398.88 day.
- avg speed: 13.07 km/s.
- max speed: 13.72 km/s.
- min speed: 12.44 km/s.
Orbital characteristics (2012)
[edit | edit source]
(Epoch J2000, 1 May 2012, 13 July 2006):[4][5]
- aphelion: 816,520,800 kilometres (5.458104 AU).
- perihelion: 740,573,600 kilometres (4.950429 AU).
- semimajor: 778,547,200 kilometres (5.204267 AU).
- eccentricity: 0.048775
- inclination: 1.305° to Ecliptic, 6.09° to Sun’s equator, 0.32° to Invariable plane.[6]
- longitude of ascending node: 100.492°
- argument of perihelion: 275.066°
- mean anomaly: 18.818°
- period: 4,332.59 days, 11.8618 julian year (yr), 10,475.8 Jupiter solar days[7]
- synodic period: 398.88 days[2]
- avg speed: 13.07 km/s.[2]
Orbital characteristics (2017)
[edit | edit source]
(Epoch J2000, 12 May 2017, February 1994):[8]
- aphelion: 5.45492 AU (816.04 Gm)
- perihelion: 4.95029 AU (740.55 Gm)
- semimajor: 5.20260 AU (778.299 Gm)
- eccentricity: 0.048498
- inclination: 1.303° to ecliptic, 6.09° to Sun’s equator, 0.32° to invariable plane (3 April 2009).[6]
- longitude of ascending node: 100.464°.
- argument of perihelion: 273.867°.
- mean anomaly: 20.020°.
- period: 11.8618 Julian year (yr), 4332.59 days, 10475.8 Jovian solar days[7]
- synodic period: 398.88 days[2]
- avg speed: 13.07 km/s[2]
Orbital characteristics (2022)
[edit | edit source]
(Epoch J2000, 18 May 2022, before 13 October 2017):[9]
- aphelion: 816.363 Gm (5.4570 AU).
- perihelion: 740.595 Gm (4.9506 AU).
- semi-major axis: 778.479 Gm (5.2038 AU).
- eccentricity: 0.0489.
- orbital period (sidereal): 11.862 yr (Julian year), 4,332.59 d, 10,476.8 Jovian solar days (before 13 August 2009).[7]
- orbital period (synodic): 398.88 d.
- average orbital speed: 13.07 km/s (8.12 mi/s).
- mean anomaly: 20.020° (February 1994).[10]
- inclination: 1.303° to ecliptic (February 1994),[10] 6.09° to Sun’s equator (February 1994),[10] 0.32° to invariable plane (July 2012).[11]
- longitude of ascending node: 100.464°.
- time of perihelion: 21 January 2023 (before 7 September 2021).[12]
- argument of perihelion: 273.867° (February 1994).[10]
Entities
[edit | edit source]
Main resources: Entities/Astronomy and Entity astronomy
The entity Thor (also called Jupiter in some cultures) is assigned to throwing lightning bolts.
Objects
[edit | edit source]
Main resource: Object astronomyFile:Haze blankets smaller red spot.jpgThis false-color view of Jupiter was taken by the Hubble Space Telescope in 2006. Credit: NASA, ESA, I. de Pater and M. Wong (University of California, Berkeley).{{fairuse}}
“[T]he ancients’ religions and mythology speak for their knowledge of Uranus; the dynasty of gods had Uranus followed by Saturn, and the latter by Jupiter.”[13]
“This false-color view of Jupiter [on the right] was taken by the Hubble Space Telescope in 2006. The red color traces high-altitude haze blankets in the polar regions, equatorial zone, the Great Red Spot, and a second red spot below and to the left of its larger cousin. The smaller red spot is approximately as wide as Earth.”[14]
“NASA’s Hubble Space Telescope is giving astronomers their most detailed view yet of a second red spot emerging on Jupiter. For the first time in history, astronomers have witnessed the birth of a new red spot on the giant planet, which is located half a billion miles away. The storm is roughly one-half the diameter of its bigger and legendary cousin, the Great Red Spot. Researchers suggest that the new spot may be related to a possible major climate change in Jupiter’s atmosphere. These images were taken with Hubble’s Advanced Camera for Surveys on April 8 and 16, 2006.”[14]
Bands
[edit | edit source]
Main resource: Radiation astronomy/BandsFile:Jupiter H2Ow.jpgJupiter is imaged with the Stockholm Infrared Camera (SIRCA) in the H2O band. Credit: M. Gålfalk, G. Olofsson and H.-G. Florén, Nordic Observatory Telescope (NOT).{{fairuse}}
At the right is a significant observation of Jupiter in the H2O band using the Stockholm Infrared Camera (SIRCA) on the Nordic Observatory Telescope (NOT).
The image clearly shows that water vapor is plentiful in the Jovian atmosphere.
Meteors
[edit | edit source]
Main resource: Radiation/Meteors


File:Jupiter-flahs.jpgA false-color composite image of Jupiter and its South Equatorial Belt shows an unusually bright spot, or outbreak, where winds are lofting particles to high altitudes. Credit: NASA/JPL-Caltech/W. M. Keck Observatory.{{fairuse}}File:High-flying white clouds above Jupiter.jpgPhoto shows high-flying white clouds above Jupiter. Credit: NASA/SWRI/MSSS/Gerald Eichstädt/Seán Doran.{{fairuse}}
Jupiter has been called the Solar System’s vacuum cleaner,[16] because of its immense gravity well and location near the inner Solar System. It receives the most frequent comet impacts of the Solar System’s planets.[17]
A 1997 survey of historical astronomical drawings suggested that the astronomer Cassini may have recorded an impact scar in 1690. The survey determined eight other candidate observations had low or no possibilities of an impact.[18] A fireball was photographed by Voyager 1 during its Jupiter encounter in March 1979.[19] During the period July 16, 1994, to July 22, 1994, over 20 fragments from the comet Shoemaker–Levy 9 (SL9, formally designated D/1993 F2) collided with Jupiter’s southern hemisphere, providing the first direct observation of a collision between two Solar System objects. This impact provided useful data on the composition of Jupiter’s atmosphere.[20][21]
On July 19, 2009, an impact site was discovered at approximately 216 degrees longitude in System 2.[22][23] This impact left behind a black spot in Jupiter’s atmosphere, similar in size to Oval BA. Infrared observation showed a bright spot where the impact took place, meaning the impact warmed up the lower atmosphere in the area near Jupiter’s south pole.[24]
A fireball, smaller than the previous observed impacts, was detected on June 3, 2010, by Anthony Wesley, an amateur astronomer in Australia, and was later discovered to have been captured on video by another amateur astronomer in the Philippines.[25] Yet another fireball was seen on August 20, 2010.[26]
On September 10, 2012, another fireball was detected.[19][27]
The second image at right shows the atmospheric impact sites for the Comet Shoemaker-Levy 9 fragments. Spectroscopic studies revealed absorption lines in the Jovian spectrum due to diatomic sulfur (S2) and carbon disulfide (CS2), the first detection of either in Jupiter, and only the second detection of S2 in any astronomical object. Other molecules detected included ammonia (NH3) and hydrogen sulfide (H2S). The amount of sulfur implied by the quantities of these compounds was much greater than the amount that would be expected in a small cometary nucleus, showing that material from within Jupiter was being revealed.
“A false-color composite image [fourth down on the right] of Jupiter and its South Equatorial Belt shows an unusually bright spot, or outbreak, where winds are lofting particles to high altitudes in this image made from data obtained by the W.M. Keck telescope on Nov. 11, 2010.”[28]
“The white clouds [in the fifth image down on the right], which get up to 50 miles (80 kilometers) wide or so, are high up in Jupiter’s atmosphere — so high that they’re very cold, and the material they shed is therefore almost certainly frozen.”[29]
“It’s snowing on Jupiter, and we’re seeing how it works.”[29]
“It’s probably mostly ammonia ice, but there may be water ice mixed into it, so it’s not exactly like the snow that we have [on Earth]. And I was using my imagination when I said it was snowing there — it could be hail.”[29]
“This photo taken by NASA’s Juno spacecraft on May 19, 2017, at 5:50 UTC from an altitude of 5,500 miles (8,900 kilometers) shows high-flying white clouds composed of water ice and/or ammonia ice. In some areas, these clouds appear to form squall lines — narrow bands of high winds and storms associated with a cold front.”[29]
Electrons
[edit | edit source]
Main resources: Radiation astronomy/Electrons and Electron astronomy
“Field-aligned equatorial electron beams [have been] observed within Jupiter’s middle magnetosphere. … the Jupiter equatorial electron beams are spatially and/or temporally structured (down to <20 km at auroral altitudes, or less than several minutes), with regions of intense beams intermixed with regions absent of such beams.”[30]
“Jovian electrons, both at Jupiter and in the interplanetary medium near Earth, have a very hard spectrum that varies as a power law with energy (see, e.g., Mewaldt et al. 1976). This spectral character is sufficiently distinct from the much softer solar and magnetospheric electron spectra that it has been used as a spectral filter to separate Jovian electrons from other sources … A second Jovian electron characteristic is that such electrons in the interplanetary medium tend to consist of flux increases of several days duration which recur with 27 day periodicities … A third feature of Jovian electrons at 1 AU is that the flux increases exhibit a long-term modulation of 13 months which is the synodic period of Jupiter as viewed from Earth”.[31]
X-rays
[edit | edit source]
Main resources: Radiation astronomy/X-rays and X-ray astronomy


The “image of Jupiter [at right] shows concentrations of auroral X-rays near the north and south magnetic poles.”[32] The Chandra X-ray Observatory accumulated X-ray counts from Jupiter for its entire 10-hour rotation on December 18, 2000. Note that X-rays from the entire globe of Jupiter are detected.
In the second at right is a diagram describing interaction with the local magnetic field. Jupiter’s strong, rapidly rotating magnetic field (light blue lines in the figure) generates strong electric fields in the space around the planet. Charged particles (white dots), “trapped in Jupiter’s magnetic field, are continually being accelerated (gold particles) down into the atmosphere above the polar regions, so auroras are almost always active on Jupiter. Electric voltages of about 10 million volts, and currents of 10 million amps – a hundred times greater than the most powerful lightning bolts – are required to explain the auroras at Jupiter’s poles, which are a thousand times more powerful than those on Earth. On Earth, auroras are triggered by solar storms of energetic particles, which disturb Earth’s magnetic field. As shown by the swept-back appearance in the illustration, gusts of particles from the Sun also distort Jupiter’s magnetic field, and on occasion produce auroras.”[33]
Ultraviolets
[edit | edit source]
Main resources: Radiation astronomy/Ultraviolets and Ultraviolet astronomy


In astronomy, very hot objects preferentially emit UV radiation (see Wien’s law). Because the ozone layer blocks many UV frequencies from reaching telescopes on the surface of the Earth, most UV observations are made from space.
At right is an ultraviolet image of aurora at Jupiter’s north pole by the Hubble Space Telescope.
At left is a recent ulraviolet image of Jupiter showing the Great Red Spot and Red Spot Jr. on 11 January 2021.
“Experiments on the Voyager 1 and 2 spacecraft and observations made by the International Ultraviolet Explorer (IUE) have provided evidence for the existence of energetic particle precipitation into the upper atmosphere of Jupiter from the magnetosphere.”[34]
The image at lower right shows Jupiter’s atmosphere at a wavelength of 2550 Angstroms after many impacts by fragments of comet Shoemaker-Levy 9. The most recent impactor is fragment R which is below the center of Jupiter (third dark spot from the right). This photo was taken 3:55 EDT on July 21, about 2.5 hours after R’s impact. A large dark patch from the impact of fragment H is visible rising on the morning (left) side. Proceeding to the right, other dark spots were caused by impacts of fragments Q1, R, D and G (now one large spot), and L, with L covering the largest area of any seen thus far. Small dark spots from B, N, and Q2 are visible with careful inspection of the image. The spots are very dark in the ultraviolet because a large quantity of dust is being deposited high in Jupiter’s stratosphere, and the dust absorbs sunlight.
Visuals
[edit | edit source]
Main resources: Radiation astronomy/Visuals and Visual astronomy

There is anecdotal evidence that people had seen the Galilean moons of Jupiter before telescopes were invented.[35]
Violets
[edit | edit source]
Main resources: Radiation astronomy/Violets and Violet astronomy

.jpg)
“This movie [at right] records an eruptive event in the southern hemisphere of Jupiter over a period of 8 Jupiter days. Prior to the event, an undistinguished oval cloud mass cruised through the turbulent atmosphere. The eruption occurs over a very short time at the very center of the cloud. The white eruptive material is swirled about by the internal wind patterns of the cloud. As a result of the eruption, the cloud then becomes a type of feature seen elsewhere on Jupiter known as “spaghetti bowls.””[36]
“As Voyager 2 approached Jupiter in 1979, it took images of the planet at regular intervals. This sequence is made from 8 images taken once every Jupiter rotation period (about 10 hours). These images were acquired in the Violet filter around May 6, 1979. The spacecraft was about 50 million kilometers from Jupiter at that time.”[36]
At left is a “Voyager 1 image showing Jupiter with its satellite Io visible at lower left. Jupiter is 140,000 km in diameter and Io is 3600 km across. This image was taken with the narrow angle camera using the violet filter from a distance of 25 million km on 9 February 1979. North is at about 11:00 (Voyager 1, 15672.37)”.[37]
“These images [at lower right] show the apparent edge (limb) of the planet Jupiter as seen through both the violet filter (top frame) and an infrared filter (756 nanometers, bottom frame) of the Solid State Imaging (CCD) system aboard NASA’s Galileo spacecraft. North is to the top of the picture. A separate haze layer is clearly visible above the northern part of the limb.”[38]
“This haze layer becomes less well defined to the south (bottom left). Such a detached haze layer has been seen previously on only one other body with a thick atmosphere: Saturn’s satellite Titan. The haze layer cannot be lower in the atmosphere than a pressure of about 10 millibars (mbar), or about 40 kilometers (km) above the tropopause. (The tropopause, where the temperature stops decreasing with height, is at about 100 mbar, 20 km above the tops of the ammonia clouds.) There is some indication of streaks of slightly brighter and darker material running roughly north-south (parallel to the limb) on Jupiter’s crescent.”[38]
“The images, which show the limb between 60.5 degrees and 61.8 degrees North latitude (planetographic) and near 315 degrees West longitude, were obtained on December 20, 1996 Universal Time. The spacecraft was about 1,286,000 km (18.0 Jovian radii) from the limb of Jupiter and the resolution is about 13 kilometers per picture element.”[38]
Blues
[edit | edit source]
Main resources: Radiation astronomy/Blues and Blue astronomy

The wide equatorial zone is visible in the center surrounded by two dark equatorial belts (SEB and NEB).
“The large grayish-blue [irregular] “hot spots” at the northern edge of the white Equatorial Zone change over the course of time as they march eastward across the planet.”[39]
“The Great Red Spot shows its counterclockwise rotation, and the uneven distribution of its high haze is obvious. To the east (right) of the Red Spot, oval storms, like ball bearings, roll over and pass each other. Horizontal bands adjacent to each other move at different rates. Strings of small storms rotate around northern-hemisphere ovals.”[39]
“Small, very bright features appear quickly and randomly in turbulent regions, candidates for lightning storms.”[39]
“The smallest visible features at the equator are about 600 kilometers (about 370 miles) across.”[39]
“The clip consists of 14 unevenly spaced timesteps, each a true color cylindrical projection of the complete circumference of Jupiter, from 60 degrees south to 60 degrees north. The maps are made by first assembling mosaics of six images taken by Cassini’s narrow-angle camera in the same spectral filter over the course of one Jupiter rotation and, consequently, covering the whole planet. Three such global maps — in red, green and blue filters — are combined to make one color map showing Jupiter during one Jovian rotation. Fourteen such maps, spanning 24 Jovian rotations at uneven time intervals comprise the movie.”[39]
The passage of time is accelerated by a factor of 600,000.
Yellows
[edit | edit source]
Main resources: Radiation astronomy/Yellows and Yellow astronomy
The #8 yellow filter is used to show Mars’s maria and Jupiter’s belts.[40]
Oranges
[edit | edit source]
Main resources: Radiation astronomy/Oranges and Orange astronomyFile:Jupiter-inset.jpgThis image of Jupiter is a composite of three color images taken on Nov. 16, 2010, by NASA’s Infrared Telescope Facility. Credit: NASA/JPL-Caltech/IRTF.{{fairuse}}
In the image at the top of the page, orange cloud bands are clearly visible on Jupiter.
“[O]range [is] the color of Jupiter”[41].
The orange and brown coloration in the clouds of Jupiter are caused by upwelling compounds that change color when they are exposed to ultraviolet light from the Sun. The exact makeup remains uncertain, but the substances are believed to be phosphorus, sulfur or possibly hydrocarbons.[42][43] These colorful compounds, known as chromophores, mix with the warmer, lower deck of clouds. The zones are formed when rising convection cells form crystallizing ammonia that masks out these lower clouds from view.[44]
“This image [on the right] of Jupiter is a composite of three color images taken on Nov. 16, 2010, by NASA’s Infrared Telescope Facility. The particles lofted by the initial outbreak are easily identified in green as high altitude particles at the upper right, with a second outbreak to the lower left.”[28]
“Earlier this year, one of Jupiter’s stripes went missing. The Southern Equatorial Band started to get lighter and paler, and eventually disappeared. Now, follow-up images from both professional and amateur astronomers are showing some activity in the area of the SEB, and scientists now believe the vanished dark stripe is making a comeback.”[28]
“The reason Jupiter seemed to ‘lose’ this band – camouflaging itself among the surrounding white bands – is that the usual downwelling winds that are dry and keep the region clear of clouds died down. One of the things we were looking for in the infrared was evidence that the darker material emerging to the west of the bright spot was actually the start of clearing in the cloud deck, and that is precisely what we saw.”[45]
“This white cloud deck is made up of white ammonia ice. When the white clouds float at a higher altitude, they obscure the missing brown material, which floats at a lower altitude. Every few decades or so, the South Equatorial Belt turns completely white for perhaps one to three years, an event that has puzzled scientists for decades. This extreme change in appearance has only been seen with the South Equatorial Belt, making it unique to Jupiter and the entire solar system.”[28]
“The white band wasn’t the only change on the big, gaseous planet. At the same time, Jupiter’s Great Red Spot became a darker red color.”[28]
“The color of the spot – a giant storm on Jupiter that is three times the size of Earth and a century or more old – will likely brighten a bit again as the South Equatorial Belt makes its comeback.”[45]
“The South Equatorial Belt underwent a slight brightening, known as a “fade,” just as NASA’s New Horizons spacecraft was flying by on its way to Pluto in 2007. Then there was a rapid “revival” of its usual dark color three to four months later. The last full fade and revival was a double-header event, starting with a fade in 1989, revival in 1990, then another fade and revival in 1993. Similar fades and revivals have been captured visually and photographically back to the early 20th century, and they are likely to be a long-term phenomenon in Jupiter’s atmosphere.”[28]
Reds
[edit | edit source]
Main resources: Radiation astronomy/Reds and Red astronomyFile:Jupiter-panel-1879-2014-comp.jpgAt left, Photograph of Jupiter’s enormous Great Red Spot in 1879 from “A History of Astronomy in the 19th Century” by Agnes Clerke. Captured by Andrew Ainslie Common in Ealing, London on 3 September 1879 using a 36″ reflector, this was the first clear photograph of another planet. Credit: Agnes Clerke and NASA.{{fairuse}}
The Great Red Spot (GRS) is a persistent anticyclonic storm, 22° south of Jupiter’s equator, which has lasted for at least 195 years and possibly longer than 360 years.[46][47] The storm is large enough to be visible through Earth-based telescopes. Its dimensions are 24–40,000 km west–to–east and 12–14,000 km south–to–north. The spot is large enough to contain two or three planets the size of Earth. At the start of 2004, the Great Red Spot had approximately half the longitudinal extent it had a century ago, when it was 40,000 km in diameter. The Great Red Spot’s latitude has been stable for the duration of good observational records, typically varying by about a degree.
It is not known exactly what causes the Great Red Spot’s reddish color. Theories supported by laboratory experiments suppose that the color may be caused by complex organic molecules, red phosphorus, or yet another sulfur compound. The Great Red Spot (GRS) varies greatly in hue, from almost brick-red to pale salmon, or even white. The reddest central region is slightly warmer than the surroundings, which is the first evidence that the Spot’s color is affected by environmental factors.[48] The spot occasionally disappears from the visible spectrum, becoming evident only through the Red Spot Hollow, which is its niche in the South Equatorial Belt. The visibility of GRS is apparently coupled to the appearance of the SEB; when the belt is bright white, the spot tends to be dark, and when it is dark, the spot is usually light. The periods when the spot is dark or light occur at irregular intervals; as of 1997, during the preceding 50 years, the spot was darkest in the periods 1961–66, 1968–75, 1989–90, and 1992–93.[49]
“Jupiter’s most celebrated atmospheric beauty mark, the Great Red Spot (GRS), has been shrinking for years. When I was a kid in the ’60s peering through my Edmund 6-inch reflector, not only was the Spot decidedly red, but it was extremely easy to see. Back then it really did span three Earths.”[50]
“In the 1880s the GRS resembled a huge blimp gliding high above white crystalline clouds of ammonia and spanned 40,000 km (25, 000 miles) across. You couldn’t miss it even in those small brass refractors that were the standard amateur observing gear back in the day. Nearly one hundred years later in 1979, the Spot’s north-south extent has remained virtually unchanged, but it’s girth had shrunk to 25,000 km (15,535 miles) or just shy of two Earth diameters. Recent work done by expert astrophotographer Damian Peach using the WINJUPOS program to precisely measure the GRS in high resolution photos over the past 10 years indicates a continued steady shrinkage:”[50] 2003 Feb – 18,420km (11,445 miles) 2005 Apr – 18,000km (11,184) 2010 Sep – 17,624km (10,951) 2013 Jan – 16,954km (10,534) 2013 Sep – 15,894km (9,876) 2013 Dec – 15,302km (9,508) = 1.2 Earth diameters.
“Not only has the Spot been shrinking, its rotation period has been speeding up. Older references give the period of one rotation at 6 days. John Rogers (British Astronomical Assn.) published a 2012 paper on the evolution of the GRS and discovered that between 2006 to 2012 – the same time as the Spot has been steadily shrinking – its rotation period has spun up to 4 days.”[50]
“Rogers also estimated a max wind speed of 300 mph, up from about 250 mph in 2006. Despite its smaller girth, this Jovian hurricane’s winds pack more punch than ever. Even more fascinating, the Great Red Spot may have even disappeared altogether from 1713 to 1830 before reappearing in 1831 as a long, pale “hollow”. According to Rogers, no observations or sketches of that era mention it. Surely something so prominent wouldn’t be missed. This begs the question of what happened in 1831. Was the “hollow” the genesis of a brand new Red Spot unrelated to the one first seen by astronomer Giovanni Cassini in 1665? Or was it the resurgence of Cassini’s Spot?”[50]
Infrareds
[edit | edit source]
Main resources: Radiation astronomy/Infrareds and Infrared astronomy


File:Dn17491-1 800.jpgInfrared observations taken at the Keck II telescope in Hawaii reveal a bright spot where the impact occurred. The spot looks black at visible wavelengths. Credit: Paul Kalas/Michael Fitzgerald/Franck Marchis/LLNL/UCLA/UC Berkeley/SETI Institute.{{fairuse}}

File:Thermal Jupiter cut.jpgThe image shows Jupiter in the infrared. Credit: NASA.{{fairuse}}File:Jupiter’s column-averaged H3+ temperatures.pngThe average temperature in Jupiter’s upper atmosphere is a roasting 800 degrees F (426 C) — almost as hot as the surface of the hellish planet Venus. Credit: J. O’Donoghue, L. Moore, T. Bhakyapaibul, H. Melin, T. Stallard, J. E. P. Connerney & C. Tao.{{fairuse}}

“Spectra from the Voyager I IRIS experiment confirm the existence of enhanced infrared emission near Jupiter’s north magnetic pole in March 1979.”[51] “Some species previously detected on Jupiter, including CH3D, C2H2, and C2H6, have been observed again near the pole. Newly discovered species, not previously observed on Jupiter, include C2H4, C3H4, and C6H6. All of these species except CH3D appear to have enhanced abundances at the north polar region with respect to midlatitudes.”[51]
The image at third lower right is “of Jupiter taken in infrared light on the night of [August 17, 2008,] with the Multi-Conjugate Adaptive Optics Demonstrator (MAD) prototype instrument mounted on ESO’s Very Large Telescope. This false color photo is the combination of a series of images taken over a time span of about 20 minutes, through three different filters (2, 2.14, and 2.16 microns). The image sharpening obtained is about 90 milli-arcseconds across the whole planetary disc, a real record on similar images taken from the ground. This corresponds to seeing details about 186 miles wide on the surface of the giant planet. The great red spot is not visible in this image as it was on the other side of the planet during the observations. The observations were done at infrared wavelengths where absorption due to hydrogen and methane is strong. This explains why the colors are different from how we usually see Jupiter in visible-light. This absorption means that light can be reflected back only from high-altitude hazes, and not from deeper clouds. These hazes lie in the very stable upper part of Jupiter’s troposphere, where pressures are between 0.15 and 0.3 bar. Mixing is weak within this stable region, so tiny haze particles can survive for days to years, depending on their size and fall speed. Additionally, near the planet’s poles, a higher stratospheric haze (light blue regions) is generated by interactions with particles trapped in Jupiter’s intense magnetic field.”[52]
The image at the top shows Jupiter in the near infrared. “Five spots — one colored white, one blue, and three black are scattered across the upper half of the planet. Closer inspection by NASA’s Hubble Space Telescope reveals that these spots are actually a rare alignment of three of Jupiter’s largest moons — Io, Ganymede, and Callisto — across the planet’s face. In this image, the telltale signatures of this alignment are the shadows [the three black circles] cast by the moons. Io’s shadow is located just above center and to the left; Ganymede’s on the planet’s left edge; and Callisto’s near the right edge. Only two of the moons, however, are visible in this image. Io is the white circle in the center of the image, and Ganymede is the blue circle at upper right. Callisto is out of the image and to the right. … Jupiter appears in pastel colors in this photo because the observation was taken in near-infrared light. Astronomers combined images taken in three near-infrared wavelengths to make this color image. The photo shows sunlight reflected from Jupiter’s clouds. In the near infrared, methane gas in Jupiter’s atmosphere limits the penetration of sunlight, which causes clouds to appear in different colors depending on their altitude. Studying clouds in near-infrared light is very useful for scientists studying the layers of clouds that make up Jupiter’s atmosphere. Yellow colors indicate high clouds; red colors lower clouds; and blue colors even lower clouds in Jupiter’s atmosphere. The green color near the poles comes from a thin haze very high in the atmosphere. Ganymede’s blue color comes from the absorption of water ice on its surface at longer wavelengths. Io’s white color is from light reflected off bright sulfur compounds on the satellite’s surface. … In viewing this rare alignment, astronomers also tested a new imaging technique. To increase the sharpness of the near-infrared camera images, astronomers speeded up Hubble’s tracking system so that Jupiter traveled through the telescope’s field of view much faster than normal. This technique allowed scientists to take rapid-fire snapshots of the planet and its moons. They then combined the images into one single picture to show more details of the planet and its moons.”[53]
On July 19, 2009, a new black spot about the size of Earth was discovered in Jupiter’s southern hemisphere by an amateur astronomer. Thermal infrared analysis showed it was warm and spectroscopic methods detected ammonia. JPL scientists confirmed that another impact event on Jupiter had occurred, probably a small undiscovered comet or other icy body.[54][55][56]
“These images [at right] show the distribution of the organic molecule acetylene at the north and south poles of Jupiter, based on data obtained by NASA’s Cassini spacecraft in early January 2001. It is the highest-resolution map of acetylene to date on Jupiter. The enhanced emission results both from the warmer temperatures in the auroral hot spots, and probably also from an enhanced abundance in these regions. The detection helps scientists understand the chemical interactions between sunlight and molecules in Jupiter’s stratosphere.”[57]
The sixth image down on the right shows Jupiter in an infrared band where the Great Red Spot (on the lower left) is almost unseen.
The image down on the left shows global temperatures for Jupiter ranging from dark 500 K to white 1,000 K as determined by infrared astronomy measurements of the median Jovian H+
3 temperatures.
“Long black-and-white dashed lines show Jupiter’s main auroral oval, short black-and-white dashed lines correspond to the magnetic footprint of Io, and the single thick black line corresponds to the magnetic footprint of Amalthea […]. A visible computer-generated globe of Jupiter based on Hubble Space Telescope imagery is shown underneath the H+
3 temperature projection.”[58]
Compare the Juno image at left with the view of Jupiter on the lowest right created from data captured on 11 January 2017 with the Near-InfraRed Imager (NIRI) instrument at Gemini North in Hawaiʻi, the northern member of the international Gemini Observatory, a Program of NSF’s NOIRLab. It is actually a mosaic of individual frames that were combined to produce a global portrait of the planet. In the image warmer areas appear bright, including four large hot spots that appear in a row just north of the equator. South of the equator, the oval-shaped and cloud-covered Great Red Spot appears dark.
Leave a Reply